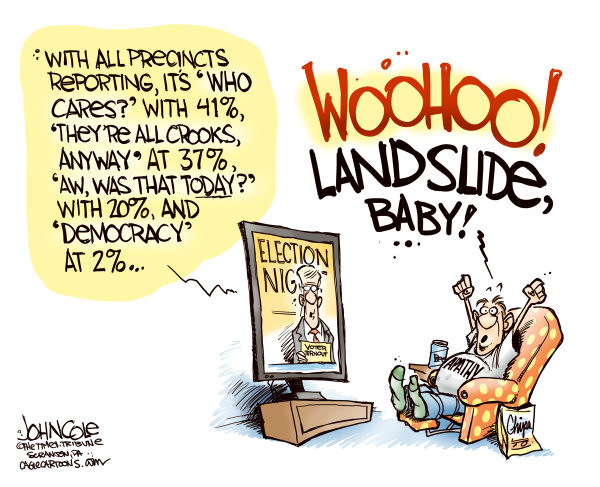
 As may have read in our post, “Minority rule?“, the turnout at the last Mayoral Democratic primary, which was in 2011, was only 25%.
“That’s pathetic.”
It is, but they – We’re not sure exactly who “they” were. – had an idea. Thinking that it would help increase turnout, but mostly to save money, the Mayor and Members of the City Council were given one-time 5 year terms so that the next Mayoral election would be held in 2016 as part of the Presidential election cycle. Financially, it was a great idea. As for its impact on campaigning and turnout, the jury is still out.
With respect to turnout, there are two problems. One is that Mayoral races can be more important and more attention getting to city voters than the contest for President. Maybe that’s one of the reasons turnout in 2011 was 10% higher than in 2012. People in the city cared more about electing their Mayor and City Council than about re-nominating their President. It’s not that the Mayor can actually affect your life to a much greater extent than what the President does. It’s just that it seems that way sometimes. More to the point, Baltimore is so Democratic that the winner of the Mayoral primary is, for all intents and purposes, the next Mayor. Not true with the winner of the Presidential primary. So the Mayoral primary is more exciting.
Another potential problem related to turnout has to do with whether or not the Presidential primary is contested. The last Presidential primary was in 2012 when President Obama was running unopposed for his second term. Turnout was just 14.78% – ten points less than the Mayoral primary the year before.
And next April? Well, if Hillary Clinton hangs in there with a commanding lead, this coming Presidential primary may also be uncontested. Then what? Will just 15% of us elect the next Mayor of 100% of us? Hardly seems fair, does it? What do the 15% know about what the other 85% of us need or want? Actually, they don’t. They just cared enough to show up and vote.
And do you know what else? The lower the turnout, the harder it is for candidates with low name recognition to win. Of the 6 most prominent candidates running for Mayor so far, one is a former Mayor who has a substantial core following. (Ironically, she’s also famous for having been forced out office as part of plea deal to vacate a criminal conviction. As a result, she has very high name recognition and “second chance sympathy support” from many well-meaning voters. It’s publicity her opponents can’t buy.) Three others are currently office holders and have either served or currently serve on the City Council. The other two have never run for office before. Needless to say, they’re are the bottom of the Baltimore Sun’s recent baseline poll because, right now, it’s all about name recognition. Problem: As a rule, if the turnout is low, the results favor known quantities.
If the turnout is low, the people who do vote may be the core, the most committed supporters of their candidate – the candidate they’ve voted for before, maybe more than once, when that candidate ran for Mayor or City Council or the legislature. The new guys, whatever their qualifications don’t have a core following. And, the thing about name recognition and familiarity? They don’t always have anything to do with experience, vision, creativity and leadership. People are just voting for who they recognize. “The Devil you know…,” so the expression goes.
In case you’re wondering about that 14.78% turnout percentage we just gave you for the 2012 Presidential primary? The map below has a dot on it for each of Baltimore’s 294 precincts. It’s interactive, so you re-center the map and zoom in or out to look at specific precincts close-up. And mousing-over or clicking on any of the red dots gives you the address of the poll, the number of eligible voters, the turnout percentage – .23 means 23% of the registered voters showed up. – and the actual number of Democratic votes cast.
There are 5 different sizes of red dots, each size representing one fifth of the total 294 precincts. The larger the dot, the higher the turnout, but don’t let the size of the dots fool you. As you can see from the legend on the map, 2012 turnout ranged from a low of just 8.33% to a high of only 32.61%.
“A high of only 32.61%?”
Come to think of it, you’re right. While the word “high” is grammatically correct, it reeks of exaggeration, doesn’t it?

