 As if you needed hard evidence of the failure of Baltimore’s public schools, here it is.
Take a look at the map that we’ve built for you. There’s one blue dot on the map for each of the 186 public schools listed by the city for SY 2015-2016. (“SY” stands for “School Year.”) The map fully interactive. You can blow it up, move it around within its frame. And you can mouse-over or click on any of the dots to see the name of the school, its street address, the grades taught and percentages for selected grades.
“What percentages are those?” They are the percentage of the students tested in 2015 in each grade, using the new PARCC test, who are classified as having “Met Expectations” or better.
“What’s the PARCC test?” Another good question. PARCC stands for “Partnership for Assessment of Readiness for College Careers.” From the name, it sounds like your children wouldn’t be taking the test until they were about to graduate high school, but that’s not the case. If the results were poor, waiting until graduation would be way too late to do anything about it. In fact, the PARCC tests are intended to assess students in grades 3 through 8 and 10 to help us understand the progress our children are making with respect to the fundamentals of “English language arts/literacy” and mathematics. These tests are about the fundamentals of undergraduate education.
To quote from the Maryland Department of Education…
PARCC helps teachers and parents determine if younger students are acquiring skills and knowledge needed to advance to the next grade level, while older students can see if they are on track to graduate, ready for college and careers.
There are actually two components of the PARCC test. One assesses the student’s understanding of mathematics. We chose to focus on the other component that assesses literacy – the student’s ability to understand and use language to communicate. PARCC and other test results are available from the “Report Card” section of Maryland Department of Education website.
Based on test results, students are placed in one of 5 categories:
Level 1: Did not meat expectations.
Level 2: Partially met expectations.
Level 3: Approached expectations.
Level 4: Met expectations.
Level 5: Exceeded expectations.
The percentages you see when you mouse-over or click on any of the dots on our map are the percent of total students tested at that school and in a given grade who were classified as having met or exceeded “expectations” as defined by the education-testing specialists who developed the PARCC tests.
The purpose of the map is to allow you to compare schools that your children might attend and, in general, appreciate the effectiveness of schools in your neighborhood or larger community. If you’re a candidate for City Council, the map allows you to appraise the quality of schools in your District and become motivated on behalf of your constituents to improve those schools.
What you’ll notice, for example, is how variable the percentages are from school to school, Although students at most schools in the city do poorly, there are some that clearly do much, much better than the average – schools such as The Mount Washington School and Roland Park Elementary/Middle School. (No surprises there.) Montessori schools do significantly better than counterparts offering more traditional programs. And charter schools do not, as a rule, appear to offer their students any particular advantage with respect to literacy as assessed by the PARCC tests.
For those of you who prefer to study lists, the link below will bring up the PDF version of the spreadsheet on which the map is based. If the type is too small, blow it up to make it easier to read.
Baltimore City Schools – SY 2015-2016

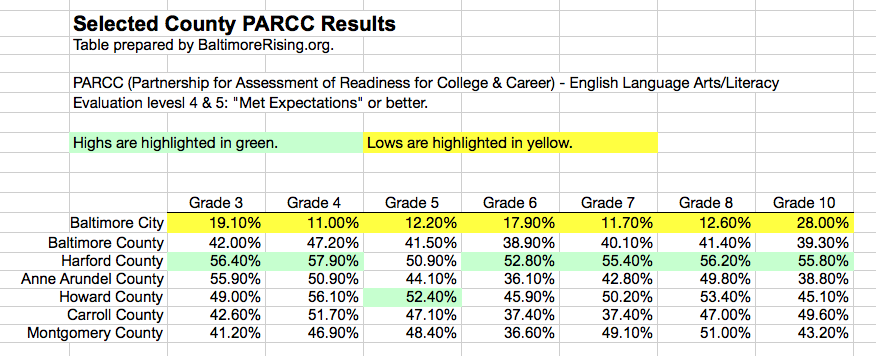
Perhaps most importantly, take a look at the table below. Click on it to make it larger. It compares the average performance of students in Baltimore City schools to students in the counties around Baltimore, plus Montgomery County.
What you’ll notice is that even the best performing public school systems – including Harford County in particular – have disappointing numbers. This is, after all, basic literacy that we’re talking about. And then there’s the really obvious, so disappointing news: Baltimore City is not only a the bottom of the list, but only one of grade levels (grade 10) is showing more than 20% of its students as meeting or exceeding expectations – and that percentage is only 28%.
Candidates and voters need to ask themselves how the city’s students can be expected to compete with their counterparts in these other counties – and how a lack of early grade literacy is impacting the ability of our children to learn as they progress through the public school system.
We need to fix this now, right now, for at least the Pre-K through Grade 3 programs and then keep it up for these students as they progress through the system until they graduate.


