 Don’t you just love pie charts? Actually, it’s the pie part that I like most. Cherry pie, the kind with crisscrossed strips of crust. Chocolate pecan pie. …Unfortunately, holiday season or not, that’s not the kind of pie we’re talking about, is it?
See the first chart below? It’s on page 116 of the city’s “Fiscal 2016 Summary of the Adopted Budget.” It breaks down the city’s budget by “Priority Outcome” – into categories like “Safer Streets” and “Better Schools.”
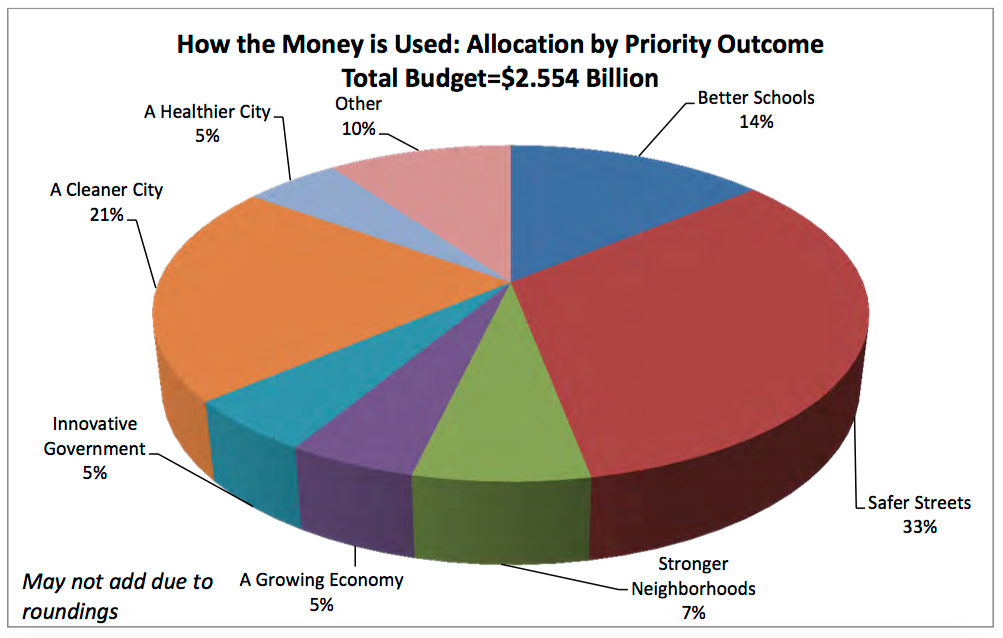
As pie charts go, this is, hands down, one of the best. Our city government’s Finance Department deserves credit for making what is otherwise a very complex document exceptionally easy to understand.
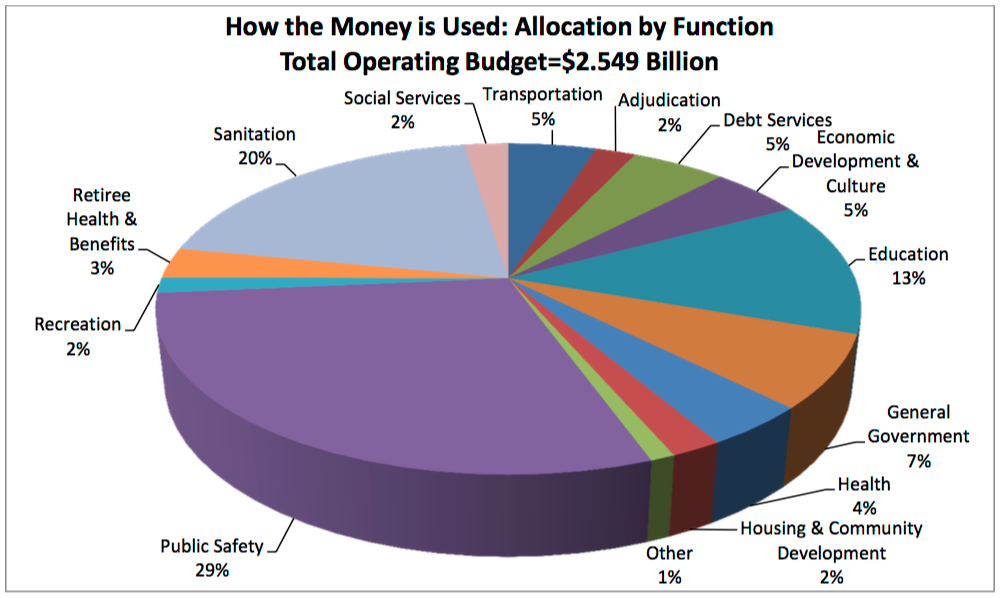
The second pie chart shows the city’s $2.549 billion budget by “function” – such as “Public Safety” and “Education.” It’s on page 117 of the same document. The two pie charts are similar, but have slices that are built of slightly different combinations of programs. That’s why, for example, the slices for Safer Streets in the first chart and Public Safety in the second are not exactly the same size.
Unfortunately, while these charts are great, what they show us is as stunning as it is unacceptable.
You can study the charts more carefully when you have time. For now, lets just focus on a couple of items beginning with the second chart, the one in which the slices of the pie define allocations by function.
Clearly, the hog at the table is Public Safety, consuming 29% of the budget. Sanitation is second at 20%. Education is third at only 13% which is less than half of what we’re spending on Public Safety. Less than half.
Needless to say, although we’ll say it anyway, if crime were less of a problem, maybe a good portion of dollars we’re now spending for Public Safety could be spent on Education.
Think about the dollar amounts we’re talking about. 29% of $2.549 billion is over $739 million for Public Safety – as compared to just 13% of $2.549 billion which is the $331 million we’re spending on Education. Regrettably, Baltimore is a city living in the present at the expense of its future.
In addition to the $331 million the city spends on Education, the city receives another $28 million from the federal government, plus almost $14 million from the state. Add it all up, and we’re spending $373 million in total, still barely more than half of the $739 million we’re spending on Public Safety.
Baltimore Rising believes that the root cause of the crime in Baltimore is an anemic economy that, for decades, has been unable to provide sufficient jobs and income for its residents. Grow the economy. Unemployment and poverty will decline and so will crime. That frees up lots of money that can be invested in Education and elsewhere in the city. Our children will be more competitive for jobs and college admissions – and generally more productive.
And that, ladies and gentlemen, breaks the negative cycle of frustration, hopelessness and despair that has gripped large segments of our city for generations. It is an ongoing recession that has robbed so many of our children of their potential. It’s not technically a crime, but just as devastating as many that the Police regularly report. Spending so much on Public Safety may be necessary, but it shouldn’t come at the expense of our children’s education.
Unfortunately, as you can see in the first pie chart, for whatever reasons – available funds and a lack of effective city government leadership being chief among them – we only spend 5% of the city’s budget on “A Growing Economy.” Economic growth, the one thing that can save the great city of Baltimore which is in desperate need of economic recovery, gets only 5% of the city’s budget.
Now how pathetic is that?
