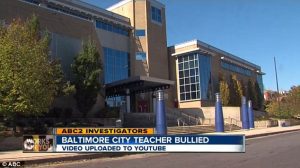
Digital Harbor High
It comes as no surprise that there is crime happening inside and on the grounds of our city’s schools. That’s obviously a bad thing that affects not only the people perpetrating these crimes and their victims, but everyone – students, faculty and administrators – at the schools where these crimes occur. It’s a particularly difficult problem when the criminals are juveniles. Just kids committing crimes and being arrested.

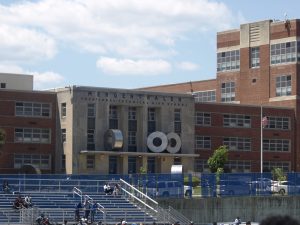
Mergenthaler Vocational Technical High
At Baltimore Rising, we believe that understanding a problem is the logical, the essential first step in resolving it. The authorities, school administrators and faculty, not the mention the students, already know what’s going on – and yet the problem persists. That’s because serious problems are seldom resolved until ordinary people everywhere become aware of what’s happening. It is for that reason that we offer you the following data – to encourage your involvement, your participation if only by virtue of casting your vote.

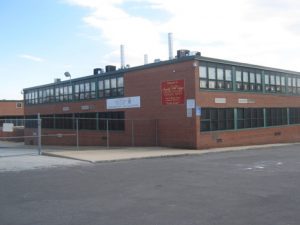
Augusta Fells Savage Institute of Visual Arts High
There are links to 2 PDFs at the bottom of this post. The first is a large spreadsheet, a table that shows how many of what kinds of crimes resulted in juvenile arrests at which schools during 2014. It’s based on data provided to as by the Baltimore Police Department.
The second PDF is a list of the Baltimore City schools during SY 2014-15. (“SY” stands for “school year.”) It will help you identify schools in the arrests table that are listed by their school number.
Before you take a look, here’s what you need to know…
- The data we were given by the Police were extremely helpful, but imperfect. Some data fields were missing which is why there is a school labeled “Blank” instead of with a number. So we had no way of assigning arrests listed under that Blank column to the specific schools where they occurred.
- The data in the table do not include unreported crimes and crimes that were reported, but relative to which no arrests were made.
- There were some school numbers in the arrests data that aren’t showing on the list of schools. We’ll try to find out the names and locations of those schools and add them to the list of schools as soon as we can.
- In addition to the “Blank” column for unassigned arrests, there are 79 schools in the city at which juvenile arrests occurred in 2014.
- All total in 2014, there were 363 arrests/incidents listed in the Police data. But note: At least 40 of these arrests involved more than one juvenile, so the total number of juveniles arrested is substantially greater than 363. The data we have will not allow us to be precise, but the 40 incidents that we know involved 2 or more arrests show a total of at least 68 additional juvenile arrests. That brings the 2014 total to 363 + 68 = 431 juvenile arrests.
- In addition to these arrests of juveniles, 27 adult students and 44 non-students were arrested on school property. Another 68 students, juveniles and adults, were arrested off-site at or near the 79 schools that our table is showing.
- Of the 39 types of crime listed by the BPD, three begin with the initials “CDS.” CDS stands for “Controlled Dangerous Substance.” Illegal drugs.
- One last thing… Round numbers, a quarter of all the juvenile student arrests in the city occurred at just 6 schools at which there were 10 or more arrests in 2014. The school numbers for those schools are highlighted in green. …Aren’t you the least bit curious which 6 schools had so many arrests?
So take a look. Leave a comment if you’d like to tell us what you think or have any questions about the data. Most importantly, remember these data when you’re figuring out who you’ll be voting for in April and November for Mayor and City Council.
By the way, the featured image and two other images we’ve included above? They are three of the schools with the highest number of 2014 juvenile arrests.
Here now are the 2 PDF we promised…

